
Oil Shock Tests a Cooling Economy
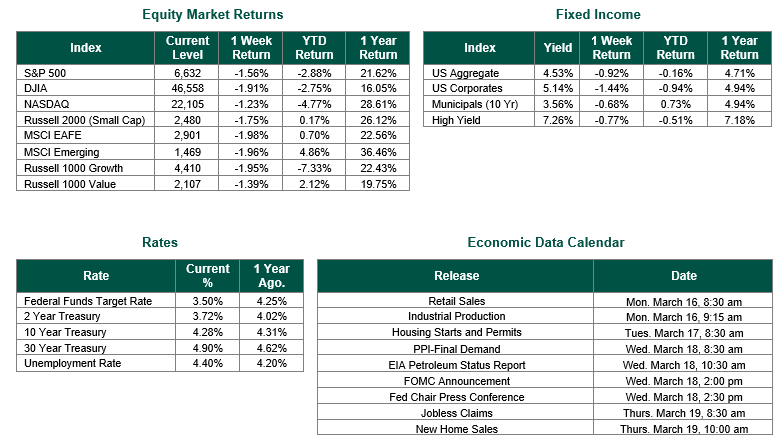
Global equity markets finished lower for the week. In the U.S., the S&P 500 Index closed the week at a level of 6632, representing a decrease of 1.56%, while the Russell Midcap Index moved -2.16% last week. Meanwhile, the Russell 2000 Index, a measure of the Nation’s smallest publicly traded firms, returned -1.75% over the week. As developed international equity performance and emerging markets were lower, returning -1.98% and -1.96%, respectively. Finally, the 10-year U.S. Treasury yield moved higher, closing the week at 4.28%.
Oil’s surge to higher levels effectively set the tone for financial markets throughout the week, with every asset class trading off the evolving energy story. Brent crude repeatedly flirted with, and then pushed above, the $100 mark as escalating conflict around Iran and threats to traffic through the Strait of Hormuz raised fears of a major supply disruption, keeping volatility elevated and headline risk high.
U.S. data released last week painted a picture of an economy where growth is cooling, inflation progress is uneven, and labor markets remain resilient but less red‑hot. Headline CPI for February rose 0.3% month on month and 2.4 percent year on year, with core CPI up 0.2% in the month and 2.5% over the year, reinforcing the narrative of gradually easing price pressures even as shelter and food costs continued to do much of the work on the upside. In contrast, the Fed’s preferred gauge showed more persistence: January’s PCE report, released Friday, showed personal income up 0.4%, disposable income up 0.9 percent, and consumer spending up 0.4%, alongside a 0.28% monthly gain in the headline PCE price index and a 0.36% rise in core PCE, leaving year‑over‑year PCE inflation at 2.8% and core PCE at a still‑elevated 3.1%. Together, the inflation prints suggested that while CPI-based measures continue to drift closer to the Federal Reserve’s 2% target, underlying price pressures in services, as captured by core PCE, remain sticky enough to keep policymakers cautious about cutting rates too quickly.
On the growth side, the second estimate of fourth‑quarter 2025 GDP confirmed a sharp loss of momentum: real GDP was revised down to a 0.7% annualized increase from the 1.4% advance estimate, a pronounced step down from the 4.4% pace in the third quarter. The composition showed softer domestic demand, as real final sales to private domestic purchasers were marked down to 1.9%, hinting that higher rates and past inflation have begun to weigh more meaningfully on private-sector activity, even as nominal GDP and price indices remained firm.
Labor‑market indicators remained a relatively bright spot and continued to signal resilience. Initial jobless claims for the week ending March 7 came in at 213,000, essentially unchanged from the prior week and better than consensus expectations, while the four‑week moving average fell to 212,000, and continued claims edged down to about 1.85 million, all consistent with historically low layoff rates and ongoing success for displaced workers in finding new jobs. The January JOLTS report likewise pointed to a market that has cooled from its peak but remains reasonably tight: job openings were roughly 6.9 million, corresponding to a 4.2% openings rate, little changed overall but still representing an increase from December with notable strength in finance and insurance, while the quit rate held around 2% and layoffs stayed near 1%. Taken together, the claims and JOLTS data suggest that while demand for labor is no longer surging, employers are still reluctant to shed workers aggressively.
Markets expect the FOMC to leave rates unchanged at this week’s March 17–18 meeting, with futures pricing essentially no chance of a cut and a growing belief that any easing will be pushed back to September or later in response to sticky inflation and the recent oil shock. This week’s FOMC gathering is also one of the quarterly meetings that includes an update to the Summary of Economic Projections and the Dot Plot chart. Forecasters believe that the updated Dot Plot chart will likely show one or fewer forecasted rate cuts for 2026.
Our thoughts and prayers continue to be focused on the brave Men and Women of the U.S. Military and our Allies during this conflict in the Middle East.
Equity and Fixed Income Index returns sourced from Bloomberg on 3/13/26. CPI data and the JOLTS Report were sourced from the Bureau of Labor Statistics. Weekly Jobless Claims are sourced from the U.S. Department of Labor. PCE and GDP data were sourced from the Bureau of Economic Analysis. International developed markets are measured by the MSCI EAFE Index, emerging markets are measured by the MSCI EM Index, and U.S. Large Caps are defined by the S&P 500 Index. Sector performance is measured using the GICS methodology.
Disclosures: Past performance does not guarantee future results. We have taken this information from sources that we believe to be reliable and accurate. Hennion and Walsh cannot guarantee the accuracy of said information and cannot be held liable. You cannot invest directly in an index. Diversification can help mitigate risk and volatility in your portfolio, but it does not guarantee profits or protect against losses.